
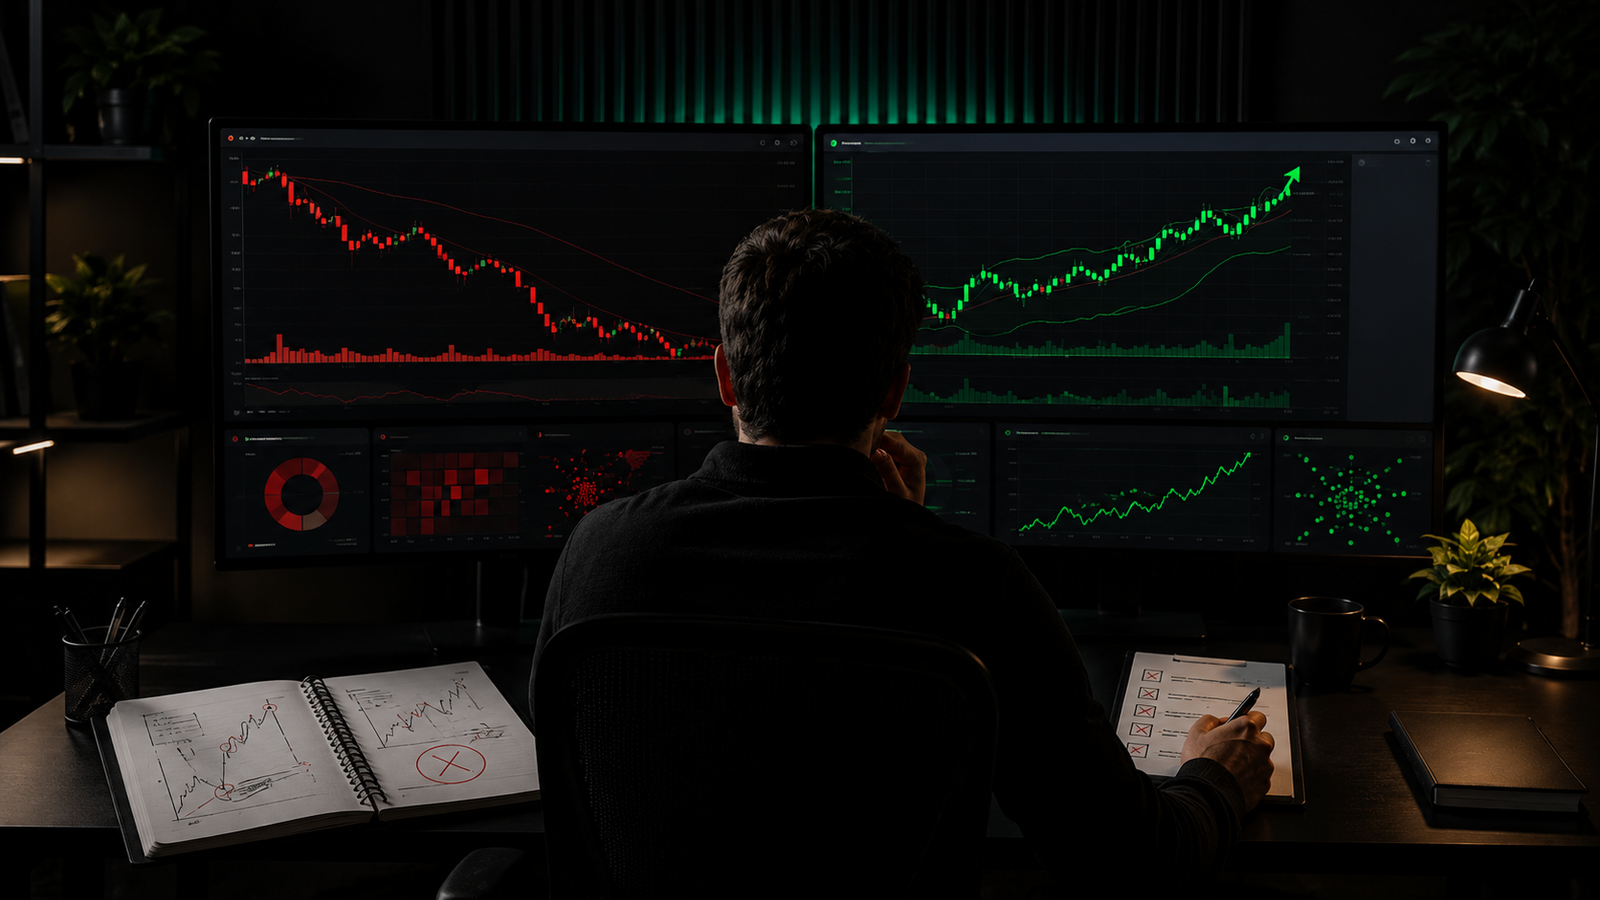
Most traders ask themselves one question after a losing position: “Why did I lose money?” But for systematic trading, a more useful question is: “Did I break my trading rules?”
Proper trade analysis for traders does not begin with whether the PnL is red or green. It begins with evaluating the quality of the decision: Was there a valid signal? Did the entry match the strategy? Was the risk defined in advance? Was the trading plan followed?
A loss does not automatically mean that a mistake was made. Even a well-executed trade can hit a stop-loss because no trading system can accurately predict every market move.
At the same time, a profitable position can still be a bad trade if the trader entered without a valid signal, exceeded the allowed risk, or acted under the influence of emotions.
The purpose of trade analysis is therefore to separate normal market uncertainty from mistakes that the trader can actually control.
Why a Losing Trade Is Not Always a Mistake
One of the most dangerous habits in trading is automatically considering every losing trade a bad trade.
Imagine that a trader identifies a signal defined by their strategy, waits for confirmation, calculates the correct position size, places a stop-loss, and enters the market.
The price moves against the position and the stop-loss is triggered.
The financial result is negative, but the execution process may have been completely correct. This is simply a normal loss within the trading system.
Now consider another example.
A trader enters without a complete signal because they are afraid of missing the move. After entering, the market moves against them. Instead of closing according to the plan, the trader moves the stop-loss farther away and increases the position size.
Then the price unexpectedly reverses and the position closes with a profit.
Financially, the trade is profitable. But from the perspective of the trading process, it may be much worse than the first trade.
The quality of a trading decision cannot be evaluated only by the PnL of a single trade.
This is one of the fundamental principles of trade analysis.
| Result | Rules Followed | How to Evaluate |
|---|---|---|
| Profit | Yes | Good execution |
| Loss | Yes | Normal loss within the system |
| Profit | No | Dangerous profitable mistake |
| Loss | No | Trading process error |
A trading journal should answer not only “How much did I make or lose?” but also “How exactly was that result produced?”
Why Traders Should Analyze Their Trades
Regular trade reviews turn trading history from a collection of isolated transactions into data that can be used to identify patterns.
Trade analysis can help determine:
- which strategies produce more consistent results;
- which setups lead to losses more often;
- what times of day produce weaker results;
- which instruments suit the trader best;
- how consistently risk-management rules are followed;
- whether emotional trades occur;
- what happens after a series of losses;
- which mistakes are repeated most often.
It is especially important not to draw major conclusions from the last two or three trades.
A trader can experience several stop-losses in a row even while executing a strategy correctly. Likewise, a series of profitable trades does not necessarily prove that the decisions were good.
For this reason, it is usually more useful to analyze groups of similar trades and longer periods: dozens of trades or, for active traders, 50–100 trades or more.
This does not mean that a specific number of trades is always sufficient to produce a statistically reliable conclusion. The required sample size depends on the strategy, trading frequency, and market conditions.
The main objective is to look for repeatable patterns rather than emotionally react to recent results.
7 Questions to Ask After a Losing Trade
1. Did the Entry Follow the Trading Strategy?
The first thing to check is whether there was an objective reason to open the position.
A trader should be able to explain the entry using several specific criteria.
For example:
- the required setup formed;
- the price reached the planned trading zone;
- the conditions defined by the system appeared;
- the risk was within the allowed limits.
If the only explanation is “I thought the price was about to go up,” the decision may have been impulsive.
Particular attention should be paid to entries made after a strong market move when the trader feels the need to “jump in before it is too late.”
2. Was the Risk Defined in Advance?
Before opening a position, a trader should ideally know:
- where the trading idea becomes invalid;
- where the stop-loss will be placed;
- what position size is acceptable;
- how much capital is at risk;
- whether the potential reward justifies the risk.
If risk is calculated only after entering the trade, the decision-making process becomes significantly more emotional.
3. Was the Stop-Loss Moved?
Moving a stop-loss in a direction that increases the potential loss is an important warning sign during trade analysis.
If the trader initially accepted a certain potential loss but then decided to give the market “a little more room” after the price moved against the position, the original risk is no longer fixed.
A single occurrence may seem insignificant. But if moving stop-losses becomes recurring behavior, it becomes a risk-management problem.
4. Was the Entry Too Late?
FOMO — the fear of missing out — often causes traders to enter after a significant part of the move has already happened.
The problem is not only the entry price.
A late entry can:
- worsen the Risk/Reward ratio;
- require a wider stop-loss;
- lead to an oversized position;
- increase emotional pressure.
When reviewing these trades, it can be useful to assign a separate FOMO tag and later compare its statistics with normal entries.
5. Did the Trade Match the Market Context?
The same setup may behave differently under different market conditions.
When reviewing a position, consider:
- overall market direction;
- current volatility;
- proximity to key levels;
- trading session;
- the character of price movement.
The goal is not to find a perfect explanation after the fact. The purpose is to determine whether the conditions matched those for which the trading strategy was originally designed.
6. Were Emotions Involved?
A trader’s emotional state should be analyzed just as systematically as entry price or position size.
Trading decisions may be influenced by:
- fear;
- greed;
- FOMO;
- overconfidence;
- revenge trading;
- the desire to quickly recover a previous loss.
The period immediately after a stop-loss can be especially dangerous.
Sometimes the next trade is opened not because a strong signal appeared, but because the trader psychologically wants to recover the money they just lost.
7. Is the Same Mistake Repeating?
This is one of the most important questions.
One late entry may be accidental. One emotional trade does not necessarily indicate a systematic problem.
But when the same behavior appears again and again, it becomes a pattern.
For example, a trader may continue following the system after the first loss but begin increasing position size after the second loss.
That conclusion is far more useful than simply saying:
“Today was a bad trading day.”
How to Analyze Trades Step by Step
A systematic trade analysis process can be divided into seven stages.
Step 1. Collect Trade Data
For a complete trade review, it is useful to save:
- asset;
- Long or Short direction;
- entry price;
- exit price;
- position size;
- PnL;
- fees;
- date;
- time;
- stop-loss;
- strategy or setup.
The more complete the trading history is, the easier it becomes to compare results.
Step 2. Identify the Reason for Entry
Ask yourself:
Why was the position opened at this exact point?
The answer should be specific.
A statement such as “The price looked like it was about to move higher” is almost impossible to analyze objectively.
Formalized entry criteria are much more useful because they can later be compared across dozens of trades.
Step 3. Compare the Trade With Your Rules
Create a simple classification:
Trade followed the rules / Trade violated the rules.
This distinction makes it possible to separate the effectiveness of the trading strategy itself from the quality of its execution.
Over time, you can compare the performance of both groups separately.
A trader may discover that the main strategy performs much more consistently than the overall PnL suggests, while a significant share of losses is generated by trades that violated the rules.
Step 4. Analyze Risk
Review:
- what percentage of capital was at risk;
- whether the position size followed your rules;
- whether the stop-loss was changed;
- whether the position was increased after entry;
- whether risk was increased without a predefined plan.
It is particularly useful to compare not only how often mistakes occur but also their financial impact.
Step 5. Review Your Emotional State
Ask yourself:
- Was I trying to recover a previous loss?
- Was I afraid of missing the move?
- Did I increase position size after a series of winning trades?
- Did I close the position too early because of fear?
- Did I re-enter immediately after being stopped out?
Emotions cannot be completely removed from trading, but traders can identify the situations in which emotions most often lead to rule violations.
Step 6. Compare the Trade With Similar Trades
Do not analyze the position in isolation.
If you are reviewing a specific setup, find other trades with the same setup.
Compare:
- win rate;
- average profit;
- average loss;
- entry time;
- direction;
- asset;
- Risk/Reward;
- rule compliance.
This is where a trading journal becomes more useful than a simple list of transactions.
Step 7. Create a Specific Conclusion
A bad conclusion:
“I need to trade better.”
It changes nothing.
A better conclusion:
“After two consecutive stop-losses, I tend to increase my position size. I will add a rule: after two losing trades, I stop trading until the next session.”
The conclusion should lead to a specific action that can be tested against future trading data.
Which Metrics Should You Analyze in a Trading Journal?
PnL
PnL shows the financial result of your trading.
It is an important metric, but it does not explain why the result occurred.
Two traders can have identical PnL while taking completely different levels of risk and demonstrating very different execution quality.
Win Rate
Win rate shows the percentage of profitable trades.
A high win rate does not automatically mean that a strategy is effective.
For example, a system may have a high win rate, but several large losses can wipe out many smaller profitable trades.
Profit Factor
Profit Factor represents the ratio of total gross profits to total gross losses.
If total profits exceed total losses, the Profit Factor will be above 1.
However, it is usually better to evaluate this metric together with other statistics rather than in isolation.
Average Winning Trade
This metric shows the typical size of a profitable trade.
It can be useful for comparing different strategies, assets, and trading periods.
Average Losing Trade
This metric helps identify the typical size of a loss.
If the average loss gradually increases, it may be worth reviewing position sizing, stop-loss placement, and trading discipline.
Risk/Reward
Risk/Reward represents the relationship between the amount risked and the potential reward of a trade.
It is particularly useful to compare the planned Risk/Reward ratio with the actual result after the position is closed.
Maximum Losing Streak
A series of losing trades can help evaluate both the behavior of the trading system and the trader during unfavorable periods.
It is also useful to examine whether trading behavior changes after several consecutive stop-losses.
Number of Trades
The number of trades provides important context for other statistics.
The same metric values should not be interpreted in the same way after 5 trades and after 100 trades.
Results by Day of the Week
Statistics may show that trading performance differs significantly on certain days.
The reason should then be analyzed separately.
Results by Time of Day
For active traders, this metric can reveal when the trader tends to make the highest-quality decisions.
Results by Instrument
BTC, ETH, and other instruments may produce different results even when the same trading logic is used.
Results by Strategy
This is one of the most useful ways to segment trading data.
The real value comes not from individual numbers but from comparing different metrics with each other.
For example:
Strategy → Time → Asset → Risk → Result
This is how patterns begin to emerge that are difficult to notice by simply reviewing a list of past transactions.
How to Find Your Most Expensive Trading Mistakes
Not all trading mistakes have the same impact on overall PnL.
Imagine that over a certain period, a trader made:
- 20 early exits;
- 8 FOMO entries;
- 4 trades without a proper stop-loss.
Based only on frequency, early exits appear to be the biggest problem.
However, after analyzing the financial impact, the trader may discover that most of the negative PnL came from just four trades without controlled stop-losses.
For this reason, mistakes should be evaluated using two criteria:
- How often does the mistake occur?
- How strongly does it affect the result?
This helps establish priorities.
Instead of trying to fix ten minor issues at the same time, a trader can first focus on one or two behavioral patterns that create the greatest risk.
Practical Example of Trader Analysis
Consider a hypothetical educational example.
A trader has completed around 120 trades. The overall result for the period is close to break-even.
The initial conclusion is:
“My strategy stopped working.”
However, after dividing the trades into different groups, a different picture becomes visible.
Trades executed according to the main strategy appear significantly more stable. A large portion of the negative results comes from additional trades opened after the first losing position of the day.
Further analysis shows that:
- additional trades are more often opened without a complete signal;
- position size sometimes exceeds the normal amount;
- their win rate is lower than the main group;
- they most often occur after an emotionally unpleasant stop-loss.
Now the conclusion changes.
The main problem may not be the trading strategy itself, but a loss of discipline after a losing trade.
These are fundamentally different situations.
In the first case, the trader might start completely redesigning the strategy.
In the second, it would make more sense to first eliminate the specific behavioral pattern and then analyze the data again.
Why Manually Reviewing Trade History Is Not Enough
Exchange trade history is necessary, but it usually shows mainly the technical side of trading:
- entry price;
- exit price;
- volume;
- direction;
- result.
For detailed analysis, this may not be enough.
It is also useful to see:
- overall statistics;
- results by period;
- win rate;
- Profit Factor;
- profitable and losing days;
- trading streaks;
- performance dynamics;
- results by instrument;
- results by strategy.
The main difference between a trading journal and a basic trade history is not simply storing trades. A journal allows traders to structure their data and compare different parts of it.
How an Automated Trading Journal Simplifies Trade Analysis
When maintaining a trading journal manually, traders have to transfer a large amount of information themselves.
With only a few trades, this is usually not a problem. But with dozens or hundreds of trades, there is a greater risk of missing a position, entering incorrect data, or simply stopping journal maintenance altogether.
An automated trading journal reduces this repetitive work.
Its main advantages include:
- trades do not need to be constantly entered manually;
- there is a lower risk of forgetting individual transactions;
- statistics are calculated automatically;
- large numbers of trades are easier to manage;
- different periods can be compared faster;
- recurring patterns are easier to identify.
Automation does not replace the trader’s own analysis.
A service can collect numbers and present them in a convenient format, but understanding why mistakes happen still requires knowledge of your own trading system and behavior.
How to Use PnLFlow for Trade Analysis
PnLFlow can be used as a tool for organizing trading statistics and analyzing completed trades.
Inside the trading journal, traders can review the history of their positions and open a detailed analysis of a specific trade.
A candlestick chart with entry and exit points helps reconstruct the market context of the position, while statistics make it possible to evaluate performance over a selected period.
PnLFlow includes:
- trading journal;
- detailed trade review;
- candlestick chart;
- entry and exit points;
- PnL;
- win rate;
- Profit Factor;
- statistics for selected periods;
- trading calendar;
- profitable and losing days;
- performance analysis by day, week, and month.
The main idea is simple:
PnLFlow does not tell traders which trade to open. It helps them understand which decisions they have already made and what results those decisions produced.
This makes the journal a tool for analyzing the trading process rather than predicting the market.
Common Mistakes When Analyzing Trading Results
Evaluating a Strategy After 2–3 Trades
A few results rarely provide the full picture.
A short losing streak may simply be part of the normal behavior of a strategy.
Considering Every Losing Trade a Bad Trade
A loss and a violation of trading rules are not the same thing.
A correctly executed trade can still end in a stop-loss.
Ignoring Bad Trades That Happened to Be Profitable
This is an especially dangerous mistake.
If breaking the rules produces a profit, the trader may start repeating the same behavior.
Looking Only at Total PnL
Overall PnL does not reveal which specific decisions produced the result.
A deeper analysis is required.
Constantly Changing the Strategy
If trading rules are changed after every short period of losses, it becomes difficult to collect comparable data.
Ignoring Risk
The same PnL can be achieved with completely different levels of risk.
For this reason, analyzing results without considering position size and potential loss provides an incomplete picture.
Looking Only for Evidence That Confirms Your Opinion
A trader may unconsciously focus only on trades that support their existing beliefs.
A complete trading journal makes it easier to evaluate the entire sample.
Deleting or Ignoring Uncomfortable Trades
The most unpleasant trades often contain the most valuable information.
If they are removed from the trading history, the statistics no longer reflect actual trading behavior.
Analyzing Data Without Reaching Specific Conclusions
A trader can spend hours reviewing charts and metrics without changing anything.
Every serious review should end with one question:
What exactly will I do differently?
How Often Should You Analyze Your Trading?
The ideal frequency depends on trading style and the number of trades.
A multi-level approach can be useful.
After Each Trade
Briefly record:
- the result;
- the reason for entry;
- whether the strategy was followed;
- risk;
- emotional state.
At the End of the Trading Day
Review the overall trading activity.
Were there unnecessary trades? Did position size change? What happened after the first loss?
Once a Week
Look for recurring trading mistakes.
A weekly review often reveals patterns that are difficult to notice within a single trading day.
Once a Month
Perform a deeper analysis.
Compare:
- PnL;
- win rate;
- Profit Factor;
- average trade result;
- losing streaks;
- instruments;
- strategies;
- days of the week;
- trading times.
High-frequency traders may benefit from reviewing performance more often. Traders with fewer trades may need to use longer periods to collect enough data for meaningful analysis.
Losing Trade Analysis Checklist
- Did the entry follow my strategy?
- Was the stop-loss defined in advance?
- Was the allowed risk respected?
- Was the position size changed?
- Was the stop-loss moved in a way that increased risk?
- Was the entry caused by FOMO?
- Was I trying to recover a previous loss?
- Did the exit follow the original plan?
- Has this mistake happened before?
- What exactly should I change in future trades?
Frequently Asked Questions
How Should Traders Analyze Their Trades?
Start by collecting objective trade data: entry price, exit price, PnL, position size, risk, time, and strategy.
Then check whether the trading rules were followed, review the emotional state surrounding the trade, and compare the position with similar trades.
The main objective is to identify recurring patterns.
Should Every Losing Trade Be Analyzed?
It is useful to record at least a short review of every trade, although the depth of analysis can vary.
Large deviations from the trading plan, risk-management violations, and recurring mistakes deserve particular attention.
For traders with a high number of transactions, group analysis can also be useful.
Which Metrics Are Most Important for Trading Analysis?
It is generally better to evaluate several metrics together:
- PnL;
- win rate;
- Profit Factor;
- average winning trade;
- average losing trade;
- Risk/Reward;
- number of trades;
- losing streaks;
- results by strategy and trading time.
A single metric rarely provides the full picture.
How Many Trades Are Needed to Analyze a Strategy?
There is no universal number.
A few trades usually provide too little information for serious conclusions. The more comparable trades you collect, the easier it becomes to identify stable patterns.
However, the required sample size depends on the trading system, signal frequency, and market conditions.
Why Can a Profitable Trade Still Be a Mistake?
Because the result and the quality of the trading process are two different things.
A trader can violate risk-management rules, enter without a valid signal, or move a stop-loss farther away, yet still make money because the market happens to move in their favor.
If this behavior becomes reinforced, it may lead to much more serious losses in the future.
What Is the Difference Between a Trading Journal and Exchange Trade History?
Exchange history primarily shows the transactions themselves.
A trading journal additionally helps aggregate statistics, compare periods, track win rate, Profit Factor, trading streaks, results by instrument, and other patterns.
How Can I Tell Whether the Problem Is My Strategy or My Discipline?
Divide your trades into at least two groups:
trades that followed the rules and trades that violated the rules.
Then compare their results.
If most of the damage comes from positions that violated your rules, the main problem may be execution and discipline.
If trades executed strictly according to the system consistently produce poor results across a sufficiently large sample, then it may be necessary to analyze the trading strategy itself more deeply.
Conclusion
The goal of trading analysis is not to eliminate losing trades completely. That is unrealistic.
Losses are a normal part of any system in which the outcome of an individual trade cannot be known in advance.
What matters much more is understanding the difference between the result of a trade and the quality of execution of the trading plan.
Effective trade analysis for traders helps identify which decisions followed the strategy, where risk-management rules were violated, and which trading mistakes continue to repeat.
Traders should not focus only on total PnL. Win rate, Profit Factor, average winning and losing trades, losing streaks, instruments, trading time, and compliance with personal trading rules should also be analyzed.
Most importantly, patterns discovered during analysis should be turned into concrete changes in the trading process.
Use PnLFlow to store your trading history, analyze trading statistics, and identify patterns in your results.
PnLFlow does not guarantee financial results and does not replace a trading strategy or risk management. Its purpose is to help organize data from completed trades and make trading analysis easier.